
Description
The Shimadzu aggregates particle size analyzer is an advanced aggregation analysis system enabling the quantitative evaluation of particle amounts in the SVP range as a concentration (unit: μg/mL). Aggregations of bio pharmaceuticals can be categorized into 3 ranges: IVP (In-visible Particle), SVP (Sub-visible Particle), and VP (Visible Particle), according to their particle size. Until now, no particle size analyzer could cover the SVP range with a single measurement. Therefore, multiple methods had to be used. The Shimadzu aggregates sizer completely covers the SVP range.
Key Features
- Measures the concentration of 100nm to 10µm aggregates of bio pharmaceuticals
- 7nm to 800um particle size distribution measurement range
- 40nm to 20um particle concentration display range
- The latest laser diffraction measurement technology
- Fully serviced, supported and calibrated here in Australia
Measures aggregates with high sensitivity
The Aggregates Sizer is over ten times more sensitive than Shimadzu’s previous SALD series (SALD-7100) particle size analyzers. This means that even micro sample quantities can be measured accurately using disposable cells for 0.4mL sample quantities.
Quantitatively evaluates aggregation processes at intervals as short as one second
Changes (sizes and quantities) in aggregates can be confirmed quantitatively as a concentration (unit: μg/mL) at intervals as short as one second. This allows observing the status at various intermediate stages, not just at two stages, before and after such changes, which allows evaluating rates of change. Using a batch cell (5mL sample capacity), aggregation processes can be observed as samples are mechanically stimulated.
Why can particle size distribution as a concentration (μg/mL) be measured using the laser diffraction method?
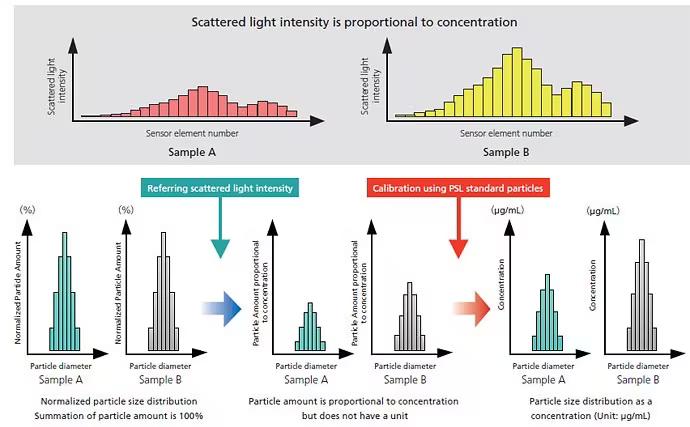
The TOP graph below shows scattered light intensity data when the same samples have been measured under the different concentration conditions. Relationship patterns between the sensor element number and light intensity are similar, and the respective light intensity detected by the sensor element of Wing sensor II is proportional to the concentration. The BOTTOM graph below shows previously, normalized particle size distribution could not be obtained as a concentration.

The difference between sample A and sample B (below) cannot be evaluated by particle size analysis using a normalized particle amount whose summation is 100%. By referring to scattered light intensity, the particle amount becomes proportional to concentration but does not have a unit. Via calibration using a PSL (polystyrene latex) standard particle, we can obtain particle size distribution as a concentration (Unit: μg/mL).
Principle of the Laser Diffraction Method by Violet Laser
There is a one-to-one correspondence between the particle diameter and the light intensity distribution pattern.
When a particle is irradiated with a laser beam, light is emitted from the particle in every direction. This is “scattered light”. The intensity of the scattered light varies with the scattering angle and describes a spatial intensity distribution pattern, known as a “light intensity distribution pattern”. If the particle diameter is large, the scattered light emitted from the particle is concentrated in the forward direction (i.e., the direction of the laser beam), and fluctuates intensely in an angular range too small to be represented in a diagram. Compared to the light emitted in the forward direction, the intensity of all other light is extremely low.
As the particle diameter becomes smaller, the pattern of the scattered light spreads outwards. As the particle becomes even smaller, the intensity of the light emitted to the side and backwards increases. The light intensity distribution pattern becomes gourd-shaped and spreads out in every direction. Therefore, there exists a one-to-one correspondence between the particle diameter and the light intensity distribution pattern. This means that the particle diameter can be ascertained by detecting the light intensity distribution pattern.
Violet laser allows accurate measurements of ultra-small particles
The light intensity distribution pattern varies little relative to the particle size distribution when the particle size drops to several tens of nanometers. This is the reason for the minimum limit of detection of the laser diffraction method. A violet laser creates clearer differences in the light intensity distribution pattern at ultra-small particle sizes than a red laser. Consequently, a violet laser is used to enhance the measurement performance for ultrafine particles of the order of several tens of nanometers.
Measurement is performed on particle groups
Particle size distribution measurement is not performed on individual particles, but on particle groups made up of a large number of particles. Particle groups contain particles of different sizes, and the light intensity distribution pattern emitted by a group is composed of all the scattered light emitted from all the individual particles. The particle size distribution, in other words, what particle sizes are present in what proportions, can be obtained by detecting and analyzing this light intensity distribution pattern. This is the basic principle behind the laser diffraction method.

Optical System in Aggregates Sizer
The laser beam emitted from the light source (semiconductor laser) is converted into a thick beam with a collimator, which is directed at the particle group. The scattered light emitted from the group in a forward direction at up to a 60° angle is concentrated with a lens, and concentric scattering images are formed at a detecting plane positioned at a distance equal to the focal length. This is detected with the wing sensor in which light-receiving elements are arranged concentrically. The scattered light emitted to the side and backwards is detected with side and back-scattered light sensors. The light intensity distribution data can be obtained by detecting scattered light data.
Overall Flow of Light Intensity Detection and Data Processing
With the Aggregates Sizer, particle size distributions are calculated using the light intensity distribution data. The overall flow of detection and data processing is shown in the diagram to the left. In measurement, the whole range of operations from the detection of scattered light intensity distribution patterns to the calculation of the particle size distribution is executed as one process, and the particle size distribution data is output. Previously, particle size analysis by laser diffraction method could only obtain a normalized particle amount whose summation is 100%. Particle size analysis by Aggregates Sizer can obtain a concentration (Unit:μg/mL) by referring scattered light intensity according to calibration using PSL standard particles.
For more information on this state-of-the-art instrument click HERE


